Engineering Services
System Design Support — engineer-led membrane projections
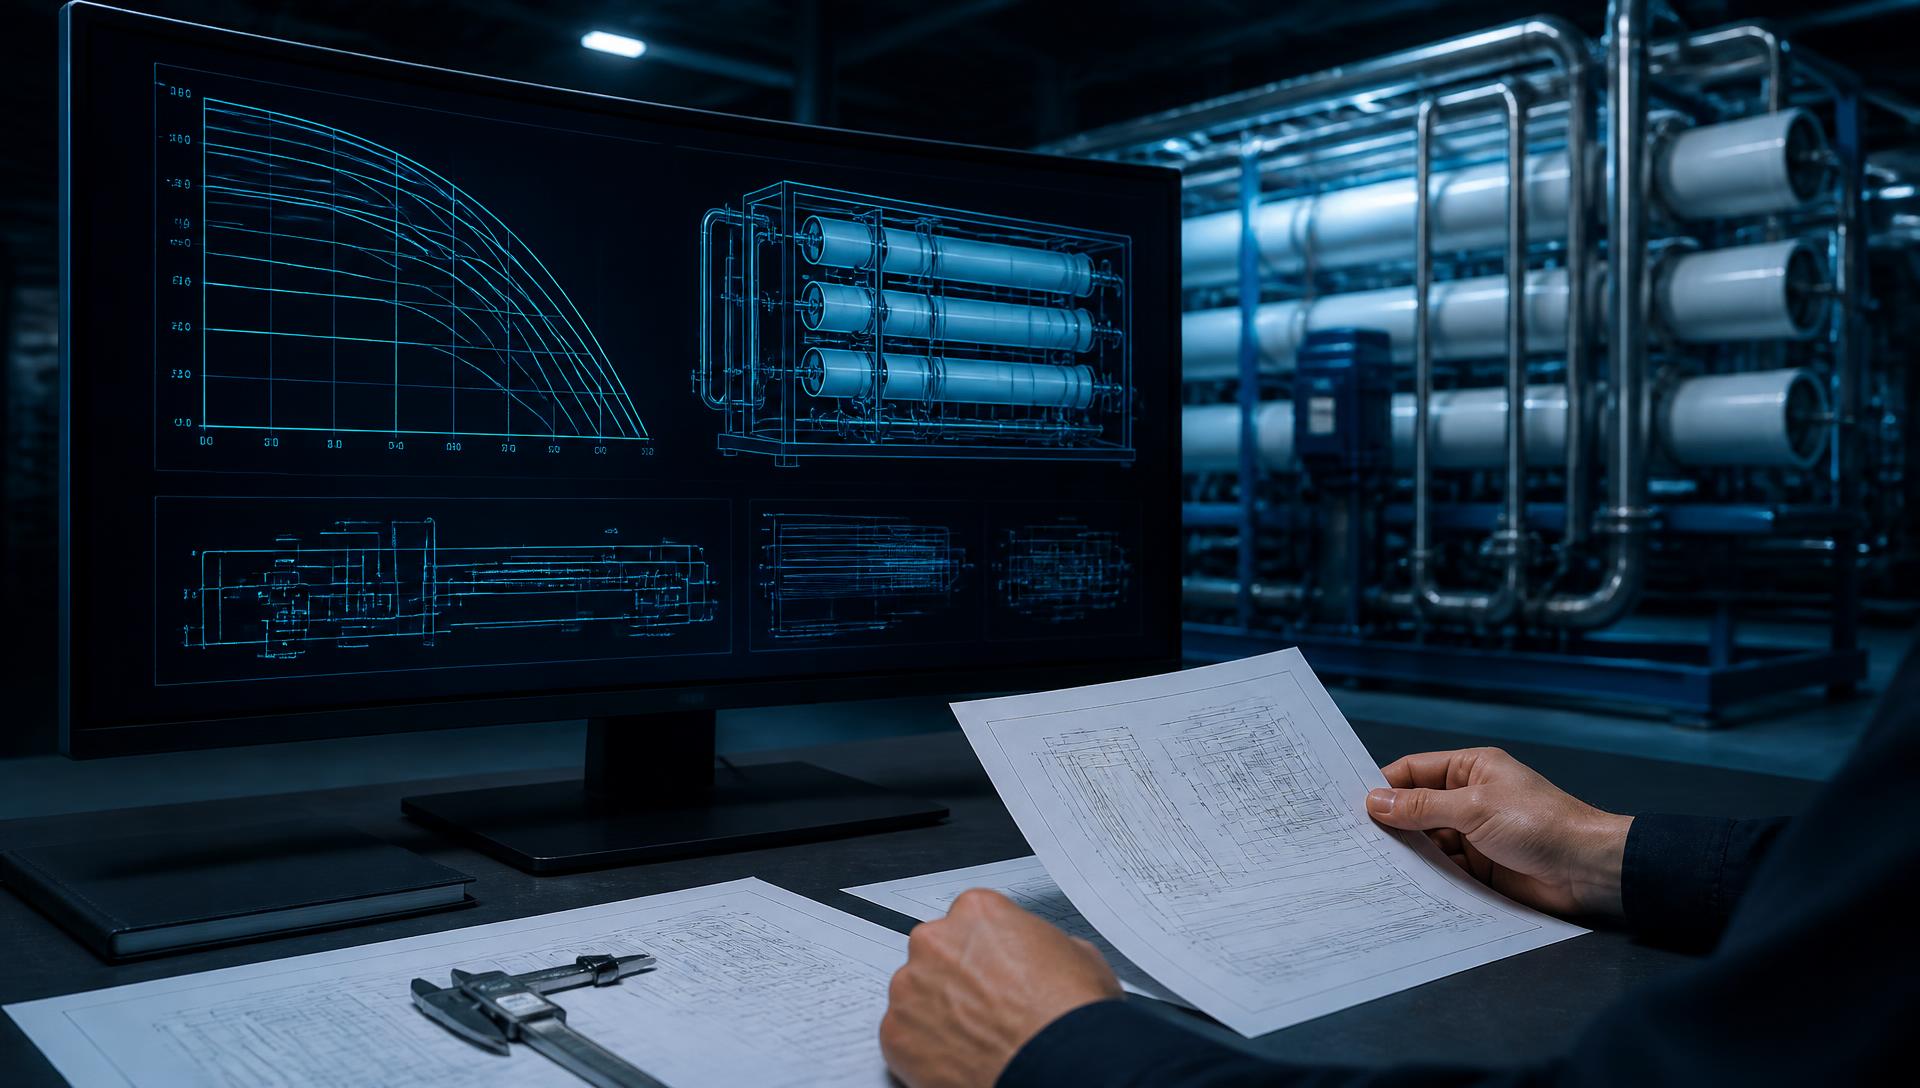
We run every projection on our own in-house design software, reviewed by process engineers rather than handed to a self-service calculator. Challenging streams — high COD, extreme pH, saturated brine, resource recovery — rarely behave the way a generic online tool predicts.
2 days
Typical turnaround on a complete feed analysis
No cost
Every reviewed projection, at no charge
In-house
Our own design software, not a generic calculator
Why engineer-led, not self-service
A public projection tool assumes clean, well-characterised feed water and a standard element. The streams we specialise in — textile CETP effluent, starch and distillery condensate, acid and caustic service, RO reject at saturation, lithium and mineral brines — sit outside those assumptions. Our engineers combine the software model with trial data from comparable plants, then state the operating window honestly, including where we would recommend a pilot before commitment.
The SV-NanoMetrix™ range is engineered for specialty duties, not standard catalogue service, so we deliberately do not publish an open online projection tool. Every projection is prepared by our engineers and delivered as a reviewed engineering report — normally within 2 working days of receiving a complete feed analysis, at no cost.
What every projection covers
Element selection & array configuration
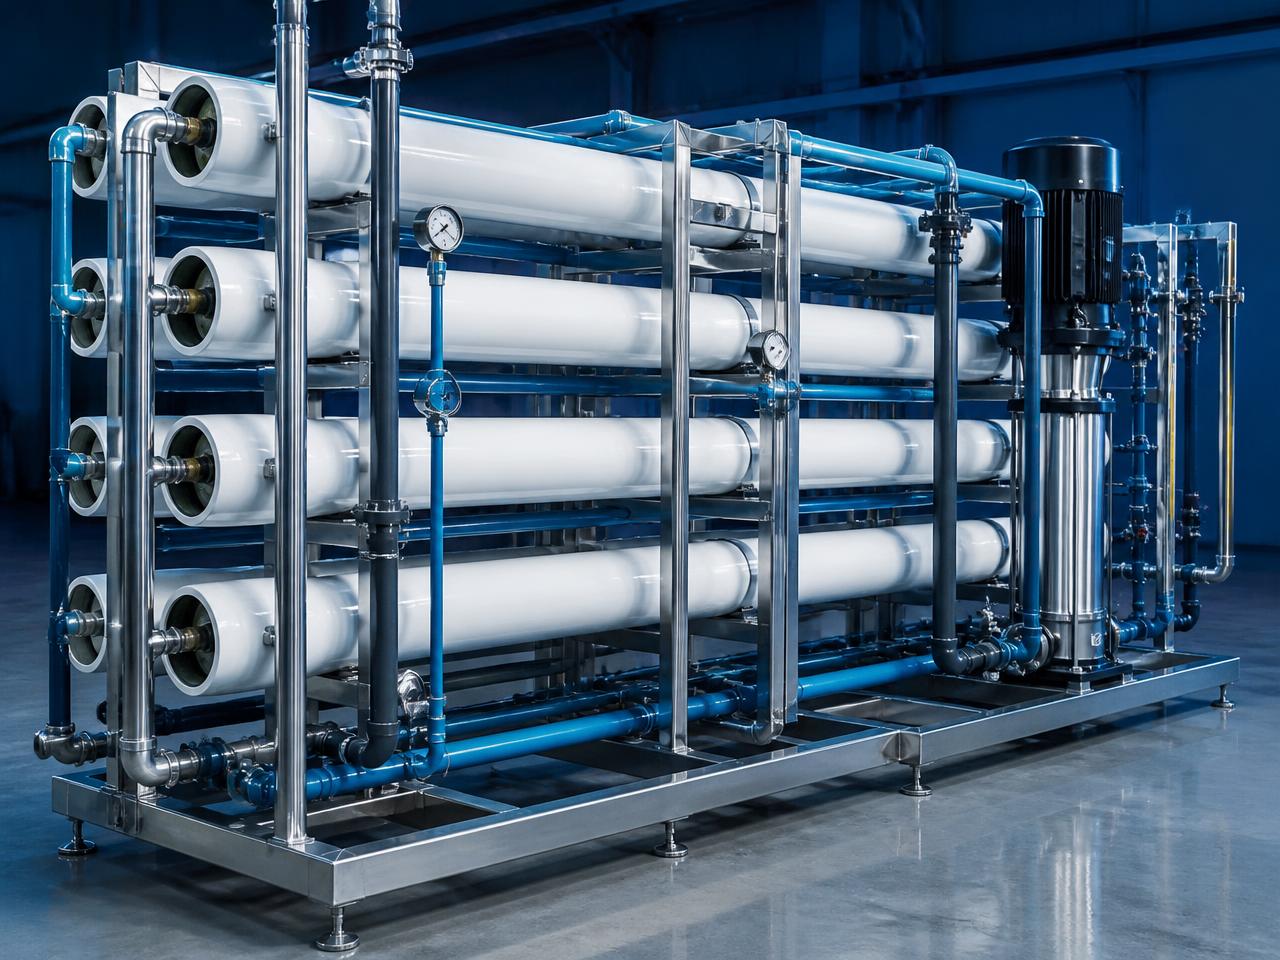
Stage count, vessels per stage, elements per vessel and staging ratio selected against your feed chemistry — RO, NF, UF, MBR or ceramic, including hybrid trains.
Flux, recovery & pressure profile
Element-by-element flux distribution, feed/permeate/concentrate TDS, operating and differential pressure, beta (concentration polarisation) and lead-element loading checks.
Scaling & fouling risk assessment
LSI/S&DSI, CaSO₄, BaSO₄, SrSO₄ and silica saturation at design recovery, antiscalant dosing guidance and organic/biofouling risk based on COD, TOC and SDI.
HDG — Hydrodynamic Channel Geometrics benefit case
Comparative run of a conventional channel versus our flagship HDG geometry: differential-pressure growth, flux decline over run hours and expected CIP interval extension.
Energy & operating cost model
Specific energy consumption, pump duty points, CIP frequency, chemical consumption and expected membrane life translated into cost per m³ of permeate.
Recovery, ZLD & retrofit studies
Brine concentration and mineral/resource recovery trains, RO-reject polishing, and drop-in retrofit projections for existing plants running conventional elements.
How it works
Four steps from your feed analysis to a reviewed design report with an engineer walkthrough.
Share feed data
Submit your feed analysis and duty targets through the verified request form below.
Engineering review
Our process team screens the chemistry, flags data gaps and selects candidate platforms.
Projection run
The case is modelled on our in-house SV-NanoMetrix™ design software, including an HDG comparison.
Report & review call
You receive a design report — arrays, flux, pressures, CIP plan and cost model — with an engineer walkthrough.
What we need — and what you receive
Data we need from you
Feed characterisation
- Full feed analysis — TDS, major ions, hardness, silica, alkalinity
- Organic load — COD, BOD, TOC, colour where relevant
- pH range, operating temperature and SDI / turbidity
- Design flow, target recovery and permeate quality requirement
- Existing plant details for retrofit and de-bottlenecking cases
What you receive
Reviewed design report
- Design report with array layout and element schedule
- Flux, pressure, recovery and permeate-quality projection
- Scaling and fouling risk assessment with dosing guidance
- CIP protocol, expected interval and membrane life estimate
- Specific energy and operating cost per m³ of permeate
Start here
Request your projection
Share your feed analysis and duty targets. Our process team will come back with a reviewed engineering report, normally within 2 working days.
Request a system design projection
Share your contact details and feed water data, and our engineers run the projection on our in-house design software.
Contact details
Process & feed water data
PDF, Word, Excel, CSV or image — up to 8 MB. Lab water analysis reports help us build a far more accurate projection.
Your data is used only to prepare your projection and follow up on the enquiry. Feed water data is treated as confidential.